Understanding the S-Curve in Project Management
The S-Curve is a graphical representation of data that follows an “S” shape, reflecting a pattern of growth that starts slowly, accelerates, and then tapers off as it approaches its maximum limit. In project management, the S-Curve is a critical tool for visualizing and monitoring project performance over time. It is particularly useful for tracking resource utilization, cumulative costs, progress, and forecasting.
Background of the S-Curve
The S-Curve originates from mathematical sigmoid functions, used to model phenomena where growth starts slow, picks up momentum, and then plateaus. This concept has been adapted into project management to monitor resource allocation, cost, and schedule adherence. Over time, it has become a standard tool in industries like construction, manufacturing, and IT.
Applications of the S-Curve in Project Management
1. Resource Management
- The S-Curve tracks the cumulative expenditure of resources (labor hours, materials, costs) over time.
- It helps project managers ensure that resource consumption aligns with the planned budget and timeline.
2. Progress Monitoring
- By comparing the planned S-Curve (baseline) with the actual S-Curve, project managers can assess whether a project is ahead, on schedule, or behind.
3. Forecasting
- The S-Curve can be extrapolated to predict future resource requirements or project milestones, assisting in proactive decision-making.
4. Risk Management
- An S-Curve derived from cumulative probability distributions is used in quantitative risk analysis to assess the likelihood of meeting project objectives.
S-Curve Usage Across Industries
1. Construction
- Practical Example: A contractor managing the construction of a high-rise building uses an S-Curve to track labor hours. Early in the project, labor deployment is minimal (site preparation). It increases sharply during construction (structural work) and slows as the project nears completion (finishing and handover).
2. Manufacturing
- S-Curves help track the production of goods. For instance, the production of smartphones starts slow due to prototyping, increases during mass production, and slows as market demand is met.
3. IT and Software Development
- In Agile or Waterfall methodologies, S-Curves chart story points or tasks completed over time, ensuring milestones are reached on schedule.
4. Infrastructure Development
- Large-scale projects, such as dam construction, use S-Curves to monitor costs, equipment usage, and labor over the project duration.
Practical Examples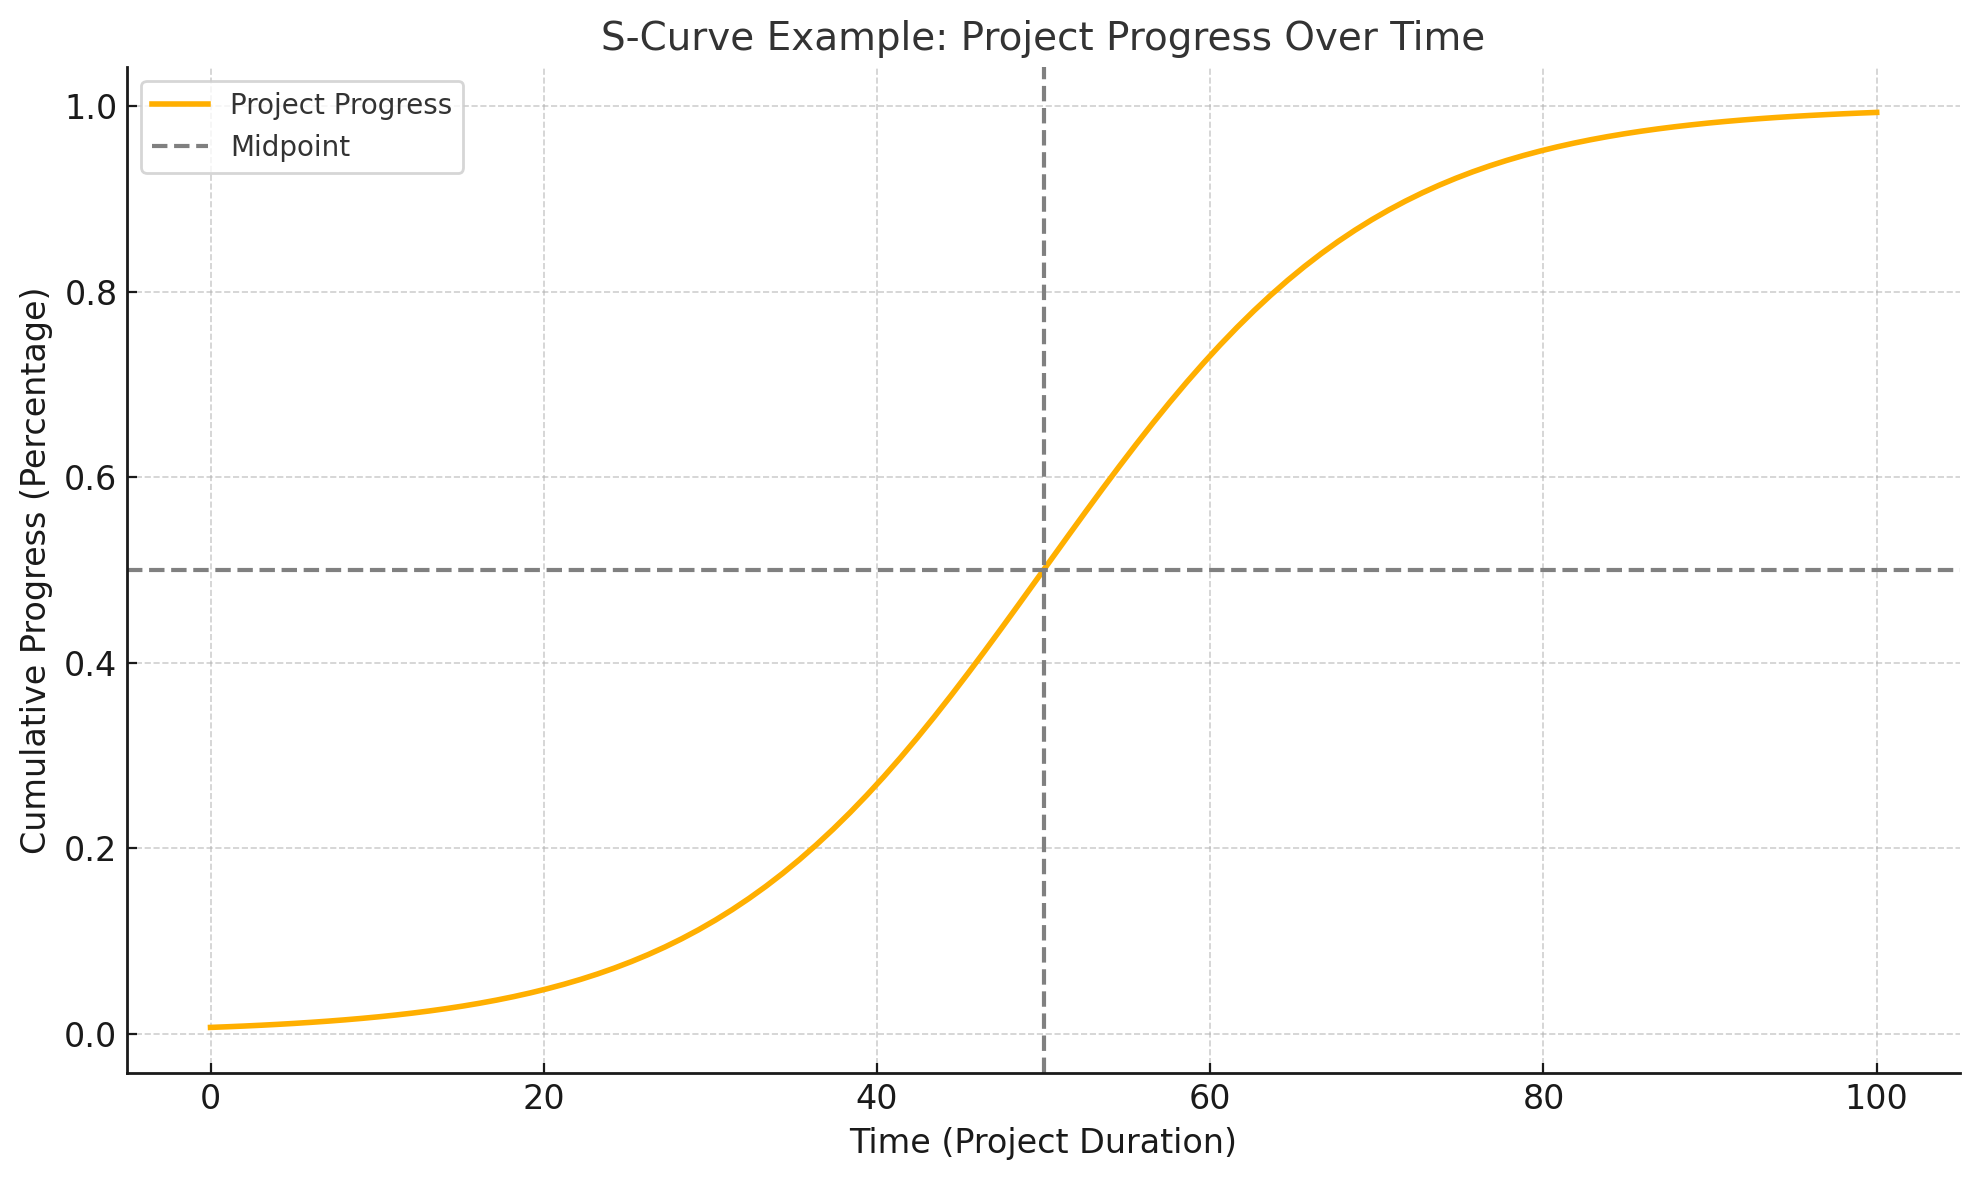
Example 1: Residential Construction Project
- Scenario: A real estate company builds a residential complex.
- Plan: The S-Curve shows minimal spending during planning and design, rapid increase during construction (materials and labor costs), and leveling off during landscaping and marketing.
- Monitoring: Regular comparisons of the actual vs. planned S-Curve reveal whether the project is overspending or delayed.
Example 2: Solar Farm Development
- Scenario: A solar energy company tracks the installation of photovoltaic panels.
- Plan: Costs start low (site preparation), peak during panel installation, and taper off during system testing and commissioning.
- Benefits: The S-Curve highlights resource bottlenecks and allows for schedule adjustments.
S-Curve in Thailand: A Real-Life Example
Project: MRT Orange Line (Bangkok)
The construction of the MRT Orange Line, a mass rapid transit project in Bangkok, uses S-Curves to monitor progress.
- Planned S-Curve: Represents expected progress milestones (e.g., excavation, tunneling, track laying).
- Actual S-Curve: Updated weekly based on real progress. The project team identifies delays in tunneling caused by unexpected soil conditions.
- Adjustments: The S-Curve comparison allows the project management team to allocate more resources to tunneling to catch up with the plan.
- Benefits: Helps ensure the project is completed within budget and on schedule, minimizing disruptions to commuters.
How to Create and Use an S-Curve
- Define Metrics: Identify what the S-Curve will represent (e.g., costs, hours, units produced).
- Collect Data: Use project plans, budgets, and schedules as the baseline.
- Chart the Data: Plot cumulative values over time.
- Analyze: Compare planned vs. actual curves to identify variances.
- Adjust: Take corrective actions based on insights.
Conclusion
The S-Curve is an indispensable tool for project managers across industries, enabling better planning, monitoring, and control. Whether it’s a high-rise building in Bangkok, a solar farm in Chiang Mai, or software development in Silicon Valley, the S-Curve provides actionable insights that lead to successful project outcomes. By visualizing progress and resource utilization, it ensures that projects remain on track, within budget, and aligned with stakeholder expectations.