Understanding Cumulative Flow Diagrams in Agile
Cumulative Flow Diagrams (CFDs) are powerful tools in Agile project management, providing a clear visualization of workflow and progress over time. They help teams track progress, identify bottlenecks, and ensure that work is flowing smoothly through different stages of a process.
What is a Cumulative Flow Diagram?
A Cumulative Flow Diagram is a stacked area chart that represents the state of work items (e.g., user stories, tasks) in various stages of the workflow. It is plotted with:
- X-axis: Time (days, sprints, or iterations).
- Y-axis: The cumulative number of work items.
Each colored band in the diagram corresponds to a specific stage of the workflow, such as “To Do,” “In Progress,” “Review,” and “Done.”
How to Use a Cumulative Flow Diagram
- Track Workflow Progress: Monitor how work items progress through different stages over time.
- Identify Bottlenecks: Analyze areas where the bands widen (indicating tasks piling up) or narrow (indicating insufficient throughput).
- Measure Throughput: Evaluate how quickly work items are being completed.
- Forecast Delivery: Predict when the remaining work will be completed by examining trends in the “Done” band.
Practical Example of Cumulative Flow Diagram Usage
Scenario: A Sprint in a Software Development Project
- Workflow Stages: To Do, In Progress, Testing, Done.
- Team Goal: Develop and test features for a new application release.
- Timeline: 10 days.
Day 1: The sprint begins with 20 tasks in the “To Do” column.
Day 5: 10 tasks move to “In Progress,” while 5 are completed and moved to “Done.”
Day 10: All 20 tasks are completed, with some passing through “Testing” before being marked as “Done.”
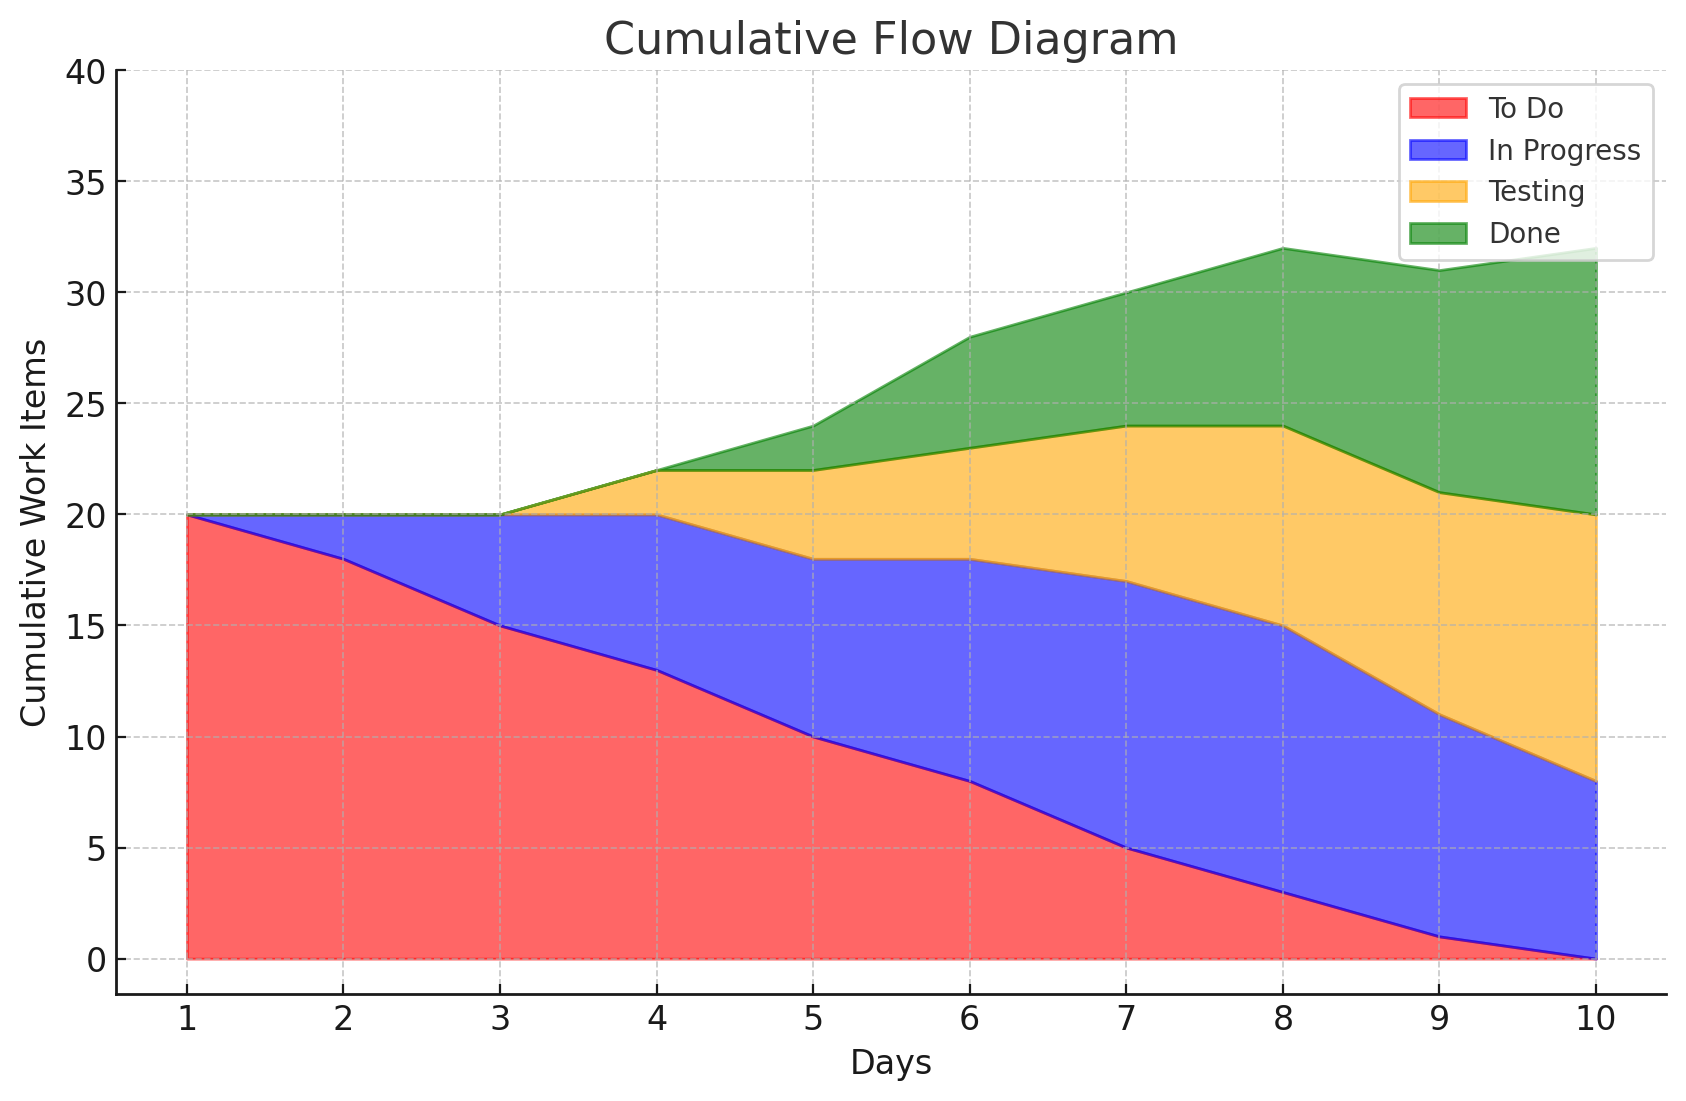
A Cumulative Flow Diagram for this scenario shows the smooth progression of tasks through the workflow stages. Any stagnation (e.g., a widening “In Progress” band) indicates a bottleneck.
Benefits of Cumulative Flow Diagrams
- Transparency: Provides a clear visual representation of team performance and workflow efficiency.
- Early Problem Detection: Highlights bottlenecks and areas needing attention before they impact deadlines.
- Continuous Improvement: Helps teams refine processes by identifying inefficiencies and improving flow.
Identifying Bottlenecks with CFDs
- Widening Bands: A growing “In Progress” band indicates too many tasks started without sufficient resources to complete them.
- Flat Bands: A stagnant “Done” band suggests work is not moving to completion, possibly due to delays in testing or review.
- Narrow Bands: A consistently thin “To Do” band may indicate insufficient work is being planned or added to the pipeline.
Example:
In a CFD, if the “Testing” band widens significantly, this could signal a bottleneck in the testing phase. This may require reallocating resources, automating tests, or addressing dependencies to speed up the workflow.
Sample Cumulative Flow Diagram

The diagram should show distinct colored bands for each workflow stage, with time on the X-axis and cumulative work items on the Y-axis. It will illustrate how work progresses and highlight any potential bottlenecks.
Key Considerations When Using Cumulative Flow Diagrams
- Update Regularly: Ensure the CFD reflects the latest workflow data to provide accurate insights.
- Focus on Trends: Use the diagram to spot patterns rather than focusing on day-to-day fluctuations.
- Address Bottlenecks Quickly: Take corrective action as soon as bottlenecks are identified.
Conclusion
Cumulative Flow Diagrams are invaluable in Agile for visualizing progress, tracking workflow efficiency, and identifying bottlenecks. By leveraging CFDs, teams can ensure a smoother flow of work, improve delivery timelines, and foster continuous improvement.