Understanding Iteration Burndown Charts in Agile
Iteration Burndown Charts are an essential tool in Agile project management, specifically in Scrum and other iterative frameworks. They provide a visual representation of the work remaining in a sprint (or iteration) versus time. By illustrating progress and identifying trends, these charts help Agile teams stay on track, adapt quickly to changes, and ensure that project goals are met within the sprint timeframe.
What is an Iteration Burndown Chart?
An Iteration Burndown Chart is a simple line chart that shows:
- X-axis: The days in the sprint or iteration (time).
- Y-axis: The amount of work remaining, usually measured in story points, hours, or tasks.
The chart typically includes:
- Ideal Work Remaining Line: A straight line from the total amount of planned work at the start of the sprint to zero at the sprint’s end.
- Actual Work Remaining Line: A line plotting the actual work completed day by day.
How to Use an Iteration Burndown Chart
- Track Daily Progress: Teams update the chart daily, usually during the stand-up meeting, by deducting completed work from the total remaining work.
- Identify Trends: Comparing the actual progress line to the ideal line helps teams assess if they are on track, ahead, or falling behind.
- Facilitate Conversations: The chart fosters discussions on impediments, bottlenecks, or scope changes.
- Adapt Planning: Teams can adjust their approach—reallocating resources or re-prioritizing tasks—to ensure they meet sprint goals.
Practical Example of Iteration Burndown Chart Usage
Scenario: A Sprint in a Web Development Project
- Team Goal: Develop a new e-commerce checkout feature.
- Sprint Duration: 10 days.
- Planned Work: 40 story points divided into tasks like UI design, API integration, and testing.
Day 1: The sprint starts with 40 story points. The team works on the UI design and completes 8 story points.
Day 5: By mid-sprint, 20 story points are completed. However, testing reveals additional defects, adding 5 story points back to the backlog.
Day 10: The team resolves all defects and completes the remaining tasks, achieving the sprint goal.
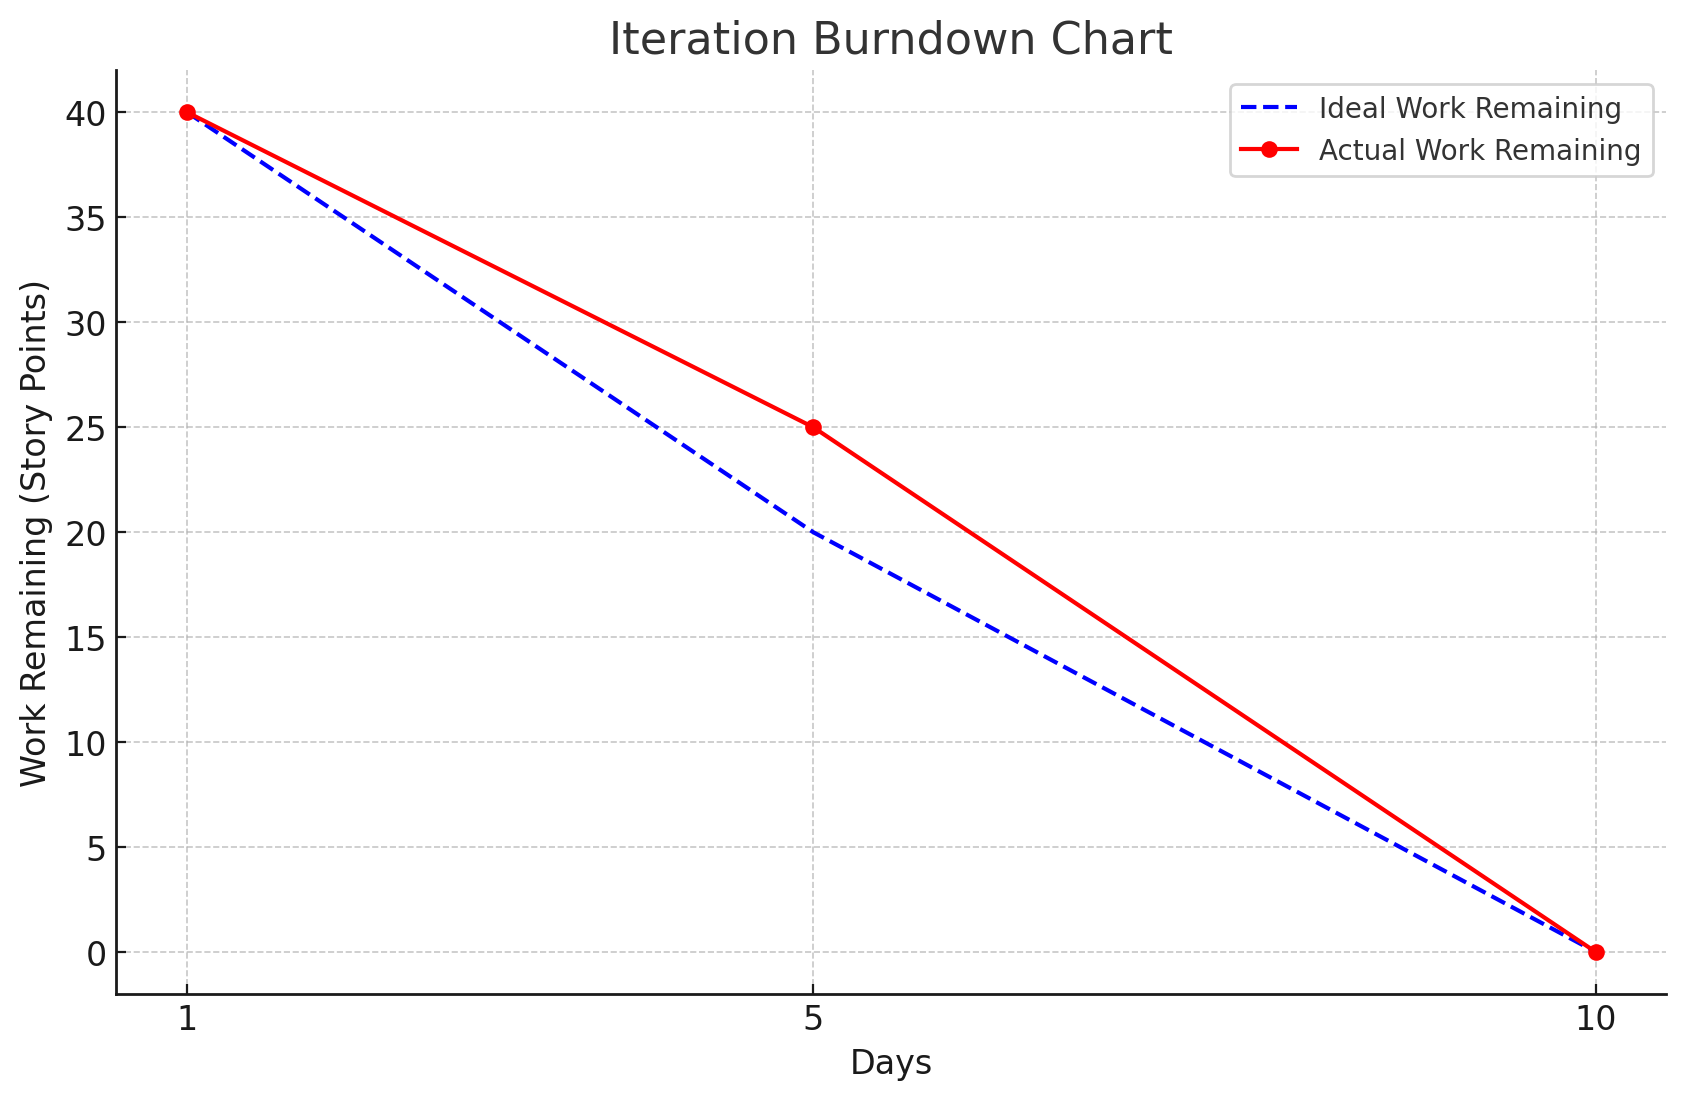
The Iteration Burndown Chart for this scenario reflects the initial planned trajectory, adjustments due to scope changes, and the eventual completion of work.
Benefits of Iteration Burndown Charts
- Transparency: Everyone on the team, including stakeholders, can see the sprint’s progress at a glance.
- Early Detection: Issues like scope creep or underperformance become evident early.
- Continuous Improvement: By analyzing trends across multiple sprints, teams can improve their planning and execution over time.
Sample Iteration Burndown Chart
Below is a visual representation of the described scenario:

The Ideal Work Remaining Line shows a consistent decline, while the Actual Work Remaining Line reflects real progress, including fluctuations due to added scope.
Key Considerations When Using Iteration Burndown Charts
- Update Regularly: Ensure the chart is updated daily to provide accurate insights.
- Account for Changes: Incorporate new tasks or scope changes to maintain relevance.
- Focus on Actionable Insights: Use the chart to identify specific actions needed to stay on track.
Conclusion
Iteration Burndown Charts are a straightforward yet powerful Agile tool. They help teams visualize progress, foster collaboration, and deliver sprint goals effectively. By leveraging these charts, teams can not only enhance their performance but also build trust with stakeholders through transparency and accountability.